Our team has been hardening how we collect and formulate the data for our UX metrics. While doing this, we decided to create a handy “cheat sheet” so everyone can easily look up the established UX Metrics in the Glare framework.
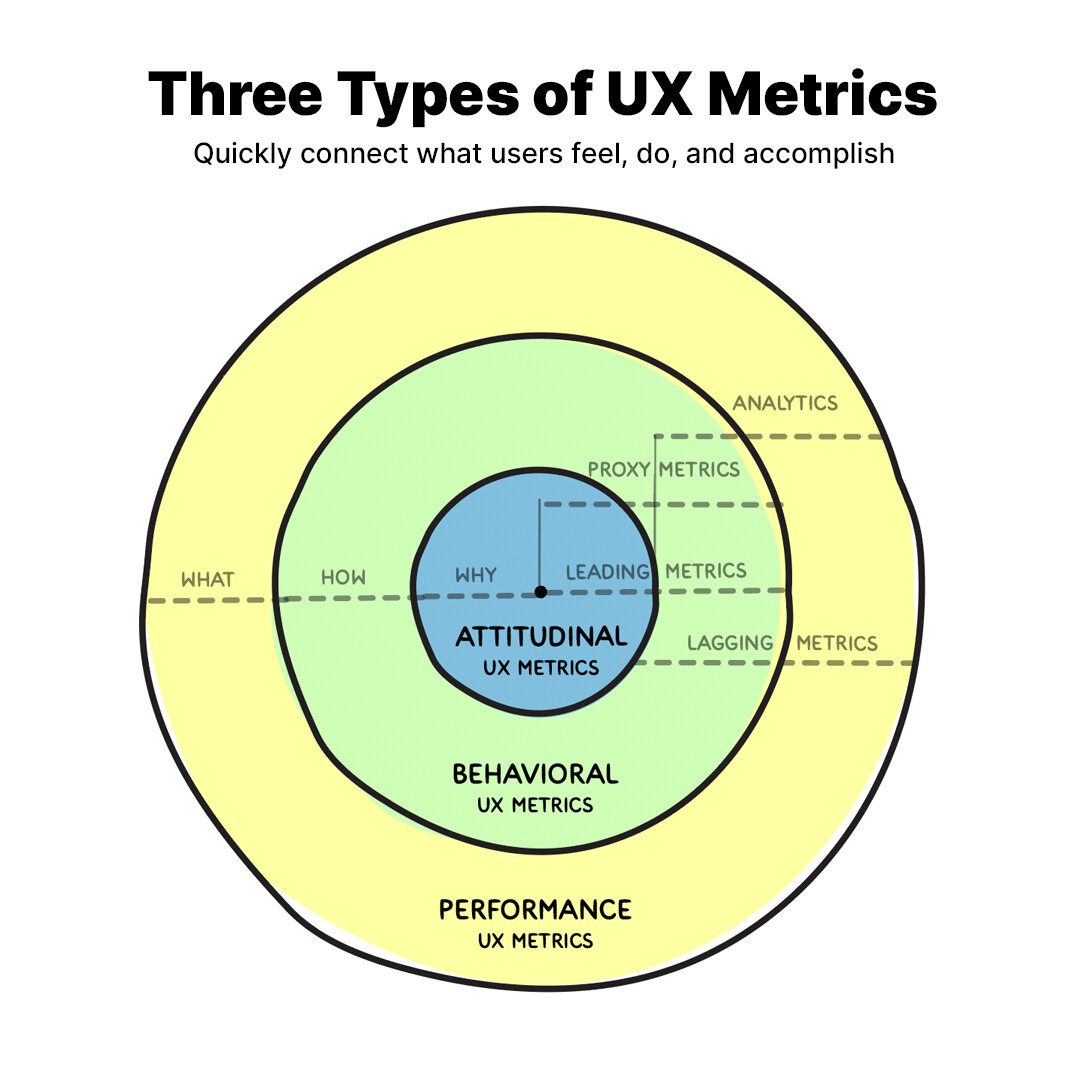
This cheat sheet organizes metrics into three main categories: Attitudinal, Behavioral, and Performance metrics. For each metric in the cheat sheet you will find a short description of its purpose, and which user needs it relates to. There’s an example of a “UX Metric card,” which summarizes real data from testings. You’ll also find the exact formula used to calculate each metric.
In total, we’ve included 28 metrics across attitudinal, behavioral, and performance categories. Together, these metrics offer a wide range of ways to track how effective your designs are. We’re really excited to learn if this cheat-sheet is a valuable reference. Please let us know in the comments what you find useful!
Key Questions:
How well do you understand the idea of behavioral, attitudinal, and performance metrics? Do you feel an explanation would be required for yourself or others?
Does the data presented here provide enough context?
What piece of information in each metric is most confusing? Least valuable?
We’ve added links to the Cheat-sheet directly to the reference content in the Glare Wiki! This means that if you’re looking for additional background, context, examples, or case studies they’re just a click away!